Computing and Computational Analysis: A six-part online course
In an increasingly number-filled world, we need to
analyze data with more than a simple calculator; systems as diverse as economic
fact sheets, the stock market, sports scores, even poker odds. This online course
looks at a number of methods to investigate data, starting with the simplicity
of BASIC and Excel, and moving on to more comprehensive programming tools such
as JavaScript, Java, Matlab and C. Along the way, youll learn the basics of
programming as well as the underlying math and, most importantly, how to mine
and analyze data.
The course is divided into six sections. In each, Ill
give an introduction to a computational concept and you can do the exercises to
see how its done. Most of the applications are freely available on the
internet, and I will direct you to the appropriate download site. Computing and
computational analysis is hands-on, and best learned by doing. The learning
curve gets easier as you go. Enjoy!
Part
One
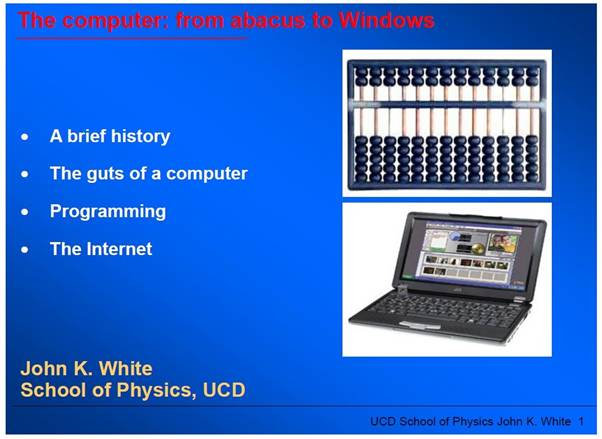
0. Overview: The Computer: From abacus to Windows [pdf
presentation]
1.
Elementary programming (loops, arrays, simple statistics) [GWBasic]
2.
Data mining, correlation, and graphing [Excel]
3. Internet programming (functions
and scripting) [JavaScript]
Part
Two (n.y.a.)
4. More internet
programming (subroutines) [Java]
5. Scientific data
analysis [Fortran, Matlab]
6. Object-oriented
programming [VB and C]
1. Elementary concepts (loops, arrays,
simple statistics) [GWBasic]
As its name implies, BASIC is basic and provides a
simple programming environment to get one started on the computational road. BASIC
was included free with the original Microsoft PC DOS, and is still free to use.
Want to calculate the average of 10 test scores (including standard deviation)
in an easy way? Just enter the data into a BASIC DATA statement (a list of
numbers separated by commas) and run a canned program. I know, most of us would
probably input the data into a spreadsheet, but spreadsheets arent very
programmable. Well use BASIC to get us going to explain the fundamentals of
programming, such as loops and arrays, as well as some elementary statistics. After
that, we can move on to more sophisticated languages with real computational power.
The GWBasic Application Programming Interface (API) is
simple, which you can download here for free: [http://www.gw-basic.com/downloads.html
(80
KB)]
|
|
|
Notes:
There
are ten function keys, of which well use only the first four: F1 (LIST), F2
(RUN), F3 (LOAD), and F4 (SAVE).
There
is no full screen mode.
|
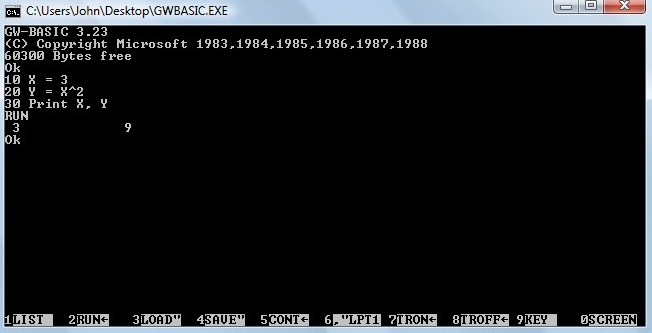
Program
1.1 Equate: A Simple Square Function
1. Download GWBasic and double-click on the icon to
launch the DOS app.
2. Type in the following 3-line program (press the Enter
key on each line to store the line).
10
X = 3
20
Y = X^2
30 Print X, Y
3. Run the program by typing RUN and pressing Enter.
You should get the result as displayed below.
4. Change the input from X = 3
to X
= 4
and run the program again. Just cursor up to line 10, change the 3 to a 4,
press Enter
to input the line, and cursor back down to the RUN line and press Enter
again (the mouse doesnt work in a DOS environment).
|
|
|
Notes:
Every
line has a number, which is typically incremented by tens.
y = x2 is coded as Y = X^2 (the syntax of the BASIC power
function is ^). Y
= X*X
is x times x, and gives the same result.
You
can press F2 to run the code (saving time as you build and debug a program).
|
Easy peasy, your first program. Of course,
programming wouldnt be very useful if the programs were all as basic as Y = X^2
for X
= 3
and X
= 4,
but the beauty is that the right side of the equation can be as simple as the
square function or as complex as working out how to land a lunar module on the
moon. Anything really.
Exercise
1.1 How
high can you go? In the Equate program, start with X = 2
and increase the exponent until you get an error. What was the value? Why?
(Hint: check the original GWBasic screen with message 60300 Bytes
free).
What form of number was output at Y = 2^24?
Exercise
1.2
What is the square root of 2 to 6 decimal places? Use the Equate
program, and recursively bisect X, starting with X = 1.4.
What happens when you bisect to the seventh decimal place? Why?
Exercise
1.3
What is the value of the function y =
2x2 - 8x - 3, when x = 4?
Exercise
1.4
What is the value of the function y =
5x4 - 3x3 + 8x2 - 4x + 2,
when x = -12?
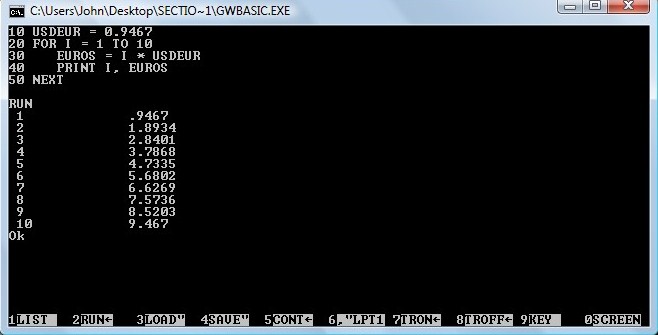
Program
1.2 Currency converter: Looping or nesting code
The foreign exchange market is a $5-trillion-a-day
business operating almost 24/7. Most trades (83%) such as the USDEUR pair are
between the five major currencies: American dollars (USD), euros (EUR), British
sterling (GBP), Japanese yen (JPY), and Australian dollars (AUS). As of April 14,
2015, the spot exchange rate of USD to EUR (USDEUR)
was 0.9467.
1. Type in the following Currency
program and run it. See that you get the same result as shown below. Here, we
have looped the conversion function to calculate and print the amount of
euros for 1 USD to 10 USD in increments of 1 dollar (using the loop variable I).
|
|
|
Notes:
Indenting
is good coding practice and makes a program easier to read (and debug).
You
could add a print header to make things more readable and print the results
to two decimals.
|
Exercise
1.5
Change the program to include a print header and 2 decimals in the output (PRINT USING
"##.##").
Exercise
1.6 Change
the program to calculate the conversion output for every half dollar (FOR I = 1
TO 10 STEP .5).
Program
1.3 Stat: Average and standard deviation
1. Input the following Stat
program, which calculates the average and standard
deviation of 10 numbers (e.g., test scores, bowling averages,
weekly food bills). Its a good idea to type the program from scratch if you
are just learning to program since Copy and Paste doesnt work in DOS. (You can
also Copy and Paste to Notepad and save with a .bas
extension.)
The DATA statement lists the marks for 10 scores
separated by commas (line 20).
The READ statement stores the marks in the NUMBERS
array using a loop (line 30-50). The average is calculated in a sum loop (line 70-90)
divided by the number of data points, N (line 130). The standard deviation is calculated
in a sum loop (line 100-120) from the sum, the sum of squares, the NUMBERS
array, and N (line 140). The results are printed in line 150.
10
N = 10
20 DATA
66,68,72,67,70,66,73,72,70,68
30
FOR I = 1 to N
40 READ NUMBERS(I)
50
NEXT I
60
SUM = 0: SSQ = 0: AVERAGE = 0: SD = 0
70
FOR I = 1 to N
80 SUM = SUM + NUMBERS(I)
90
NEXT I
100
FOR I = 1 to N
110
SSQ = SSQ + (NUMBERS(I) - SUM/N)^2
120
NEXT I
130 AVERAGE = SUM/N
140 SD = SQR(SSQ/(N-1))
150
PRINT "Ave. = " AVERAGE, "Stn. dev. = " SD
Exercise
1.7
What is the average and standard deviation of the 10 test scores?
Exercise
1.8
Change the program to add 4 scores. What is the average now with the following
4 scores added: 51, 46, 91, 89? Before you run the new data, do you expect the
standard deviation to increase, decrease, or stay the same? Why? What is the
standard deviation of the 14 scores? Note: All arrays over 10 elements must be
dimensioned (DIM). Add the line 11 DIM NUMBERS (N).
It will automatically be inserted after line 10 (Type List).
BASIC
General Notes
BASIC (Beginners All-purpose Symbolic Instruction
Code) began in 1964 at Dartmouth College as a simple high-level language for
non-science students, and is partly based on Fortran and Algol. Bill Gates and
Paul Allen got their start at Micro-Soft by writing Altair BASIC (1975).
Standard BASIC is interpreted not compiled (runs one
line at a time), although executables files (source > object > executable)
can be made (e.g., in Quick BASIC). In Quick BASIC (or QBasic) one compiles a BASIC source file to create a BASIC executable
or stand-alone .exe run file. Visual BASIC is an object-oriented and event-driven
language that is only loosely derived from BASIC.
Everything you wanted to know about BASIC: GW-BASIC User's Guide.
|
Pros
|
Cons
|
Special syntax
|
|
·
Easy for beginners
·
Quick turnaround for small programs
·
No understanding of computer hardware or
operating system
·
Advanced features for experts (string
manipulation, graphics, files, data types, subroutines, local variables)
|
·
Not very structured
·
Poor programming practices (e.g., Goto
statements)
·
Quick and easy programs will eventually
collapse
·
Not good output or graphic capability
|
·
Line numbers required
·
Rem is a comment (remark)
·
: to input multiple statements on one line
·
$ for text variables
·
For
Next
|
Note:
Windows uses an NT kernel that no longer supports DOS. You can download a
DOS-emulated PC Basic here [http://sourceforge.net/projects/pcbasic/postdownload?source=dlp
(14
MB)]. Using PC Basic, you can run old BASIC programs in full screen mode with
graphics. Here is the SIMPLOT
program I wrote to plot data.
2. Data mining, correlation, and graphing
[Excel]
Excel is not a programming language, but has simple
graphing capabilities, easy-to-use statistical functions, and can be used to
massage data for use in real programming languages. Excel is a spreadsheet
application which displays data and calculations in cells arranged as a grid of
rows and columns, e.g., 10 x-y data points in cells A1-B10. Excel is a quick
and dirty tool to manipulate data (one cuts and pastes and automatically increments
cell arrays in 1-D lists). Apples Viscalc was the first spreadsheet in 1971
and the first killer ap for microcomputers, where the software was more
important than the hardware. Lotus and Excel became industry standards, although
QuatroPro had good graphing and macro qualities.
Im not going to show you how to use Excel (there
are lots of guides out there if needed) other than to highlight how to use the correlation
tools, display a R2 correlation
coefficient on a graph, and how to write a macro using VBA, Excels programming
language.
Exercise
2.1 (Simple graphing). To get started, reproduce the
simple y = x2 graph below. (Input cells A2,B2, A3,B3, highlight,
and drag to row 12.)
|
|
A
|
B
|
B
|
|
|
1
|
x
|
y
|
(contents)
|
|
2
|
1
|
1
|
=A2^2
|
|
3
|
2
|
4
|
=A3^2
|
|
4
|
3
|
9
|
=A4^2
|
|
5
|
4
|
16
|
=A5^2
|
|
6
|
5
|
25
|
=A6^2
|
|
7
|
6
|
36
|
=A7^2
|
|
8
|
7
|
49
|
=A8^2
|
|
9
|
8
|
64
|
=A9^2
|
|
10
|
9
|
81
|
=A10^2
|
|
11
|
10
|
100
|
=A11^2
|
|
12
|
11
|
121
|
=A12^2
|
Exercise
2.2 (Data import). Calculate the average number of
homeruns hit per team in the American League and National League for the 2014
MLB season. Which league averaged more? Why? The data
can be downloaded here and imported into Excel. See DATA
TIP 1 to easily import and massage data. (To calculate the average in the cell
below the HR column, use Formulas, Insert Function, and then select Average and
OK.)
Exercise
2.3 (Correlation). Plot the number of wins
versus team
payroll for each MLB team from the 2014 season (Insert |
Scatter). What is the relationship between wins and payroll (equation and R2 correlation coefficient)?
Display the equation and correlation coefficient on the graph (select the data
on the graph, right click, Add Trendline
, and tick Display Equation and
R-squared). If I had a new team with a payroll of $130 million, how many
wins could I expect? Are sports fair?
(Yes, the data will have to be massaged a bit. Use
DATATIP1, sort alphabetically by team, remove the $ from the payroll data and
convert to millions. To convert Excel formulae to data, Paste Special
and select Values.)
You should get something like the following graph
(without the data labels). Which team got the best bang for its buck? Which
team didnt and should probably fire its GM?
Exercise
2.4 (Data Labels). It would be nice to add data labels to
see which teams benefit from their high payrolls (or not in the case of the Yankees
and others). Since there isnt a built-in Excel label
function, we will use VBA (Visual Basic for Applications) to automate the task.
You can record any series of tasks in a VBA macro. Here, we add labels on a
graph from the cells immediately to the left of the y-x data (Payroll, Wins):
|
Team
|
Team
|
Payroll
(millions$)
|
Wins
|
|
Arizona Diamondbacks
|
ARI
|
96.6
|
64
|
|
Atlanta Braves
|
ATL
|
114.5
|
79
|
|
Baltimore Orioles
|
BAL
|
109.8
|
96
|
|
|
|
|
|
Adding
labels to a graph with a VBA macro:
1. Save the file as an Excel Macro-enabled Workbook.
2. Select Developer | Macros and create a macro
called AttachLabelsToPoints.
3. Copy and Paste the subroutine
below into the macro window and save.
4. Return to the Excel main view, highlight the
graph, and run the macro (Developer | Macros | Run).
Sub
AttachLabelsToPoints()
'Dimension variables.
Dim Counter As Integer, ChartName As String,
xVals As String
' Disable screen
updating while the subroutine is run.
Application.ScreenUpdating = False
'Store the formula for
the first series in "xVals".
xVals =
ActiveChart.SeriesCollection(1).Formula
'Extract the range for
the data from xVals.
xVals = Mid(xVals, InStr(InStr(xVals,
","), xVals, _
Mid(Left(xVals, InStr(xVals,
"!") - 1), 9)))
xVals = Left(xVals, InStr(InStr(xVals,
"!"), xVals, ",") - 1)
Do While Left(xVals, 1) = ","
xVals = Mid(xVals, 2)
Loop
'Attach a label to each
data point in the chart.
For Counter = 1 To Range(xVals).Cells.Count
ActiveChart.SeriesCollection(1).Points(Counter).HasDataLabel = _
True
ActiveChart.SeriesCollection(1).Points(Counter).DataLabel.Text = _
Range(xVals).Cells(Counter,
1).Offset(0, -1).Value
Next Counter
End
Sub
Dont worry about how the macro works for now, but
note the VBA syntax for a comment (starts with '
and is green), the Do While
Loop, and the For
Next.
Exercise
2.5 (Binomial probability). Download the Random
Walk
spreadsheet, and play around with it to see the different distributions that
result from a drunkard taking 100 steps either right or left out of a pub door
(a binomial distribution). To run the simulation, press Enter
in Cell I2. (You can also bias the result with a value other than 0.5.) What is
the most likely final destination? Why doesnt he end up there after 100 steps?
What does it mean: the most likely is not very likely? Is there a symmetry to
the distances (i.e., the histogram of data)? Can you explain you answer using
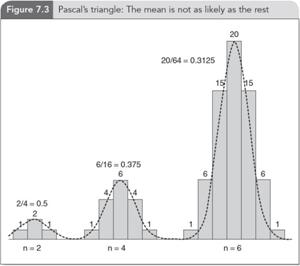
the figures below from Chapter 7 in Do The Math!?
|
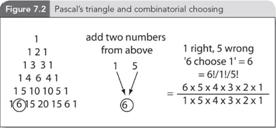
The odds of a series of binomial events (coin flips,
roulette spins, outcomes of evenly matched playoff series) is elegantly
summarized by Pascals triangle. Starting with a 1 for the top row and 1, 2,
1 for the second row, add the two numbers above to get the next line of
coefficients, and so on for successive rows.
|
|
Exercise 2.6 (Calculating binomial
odds and Pascals triangle). Pascals triangle can
be calculated for any coefficient using n! / r! / (n r)!
/ 2n,
where n is the row and r is the row coefficient, from 1 to n.
For an even 50/50 split, the probability is thus n! / (n/2)! / (n/2!)
/ 2n.
For n = 4, the probability of an even split is 37.5% (4!/2!/2!/24)
and for n = 6, 31.25% (6!/3!/3!/26) as shown above in
Figure 7.3. What is the chance of an even split for n = 8, 10, and 20? (Note that even splits apply only for even
numbers.)
|
Pros
|
Cons
|
Special syntax
|
|
·
Easy graphing
·
Easy data manipulation and formatting
(concatenate with &)
·
Straightforward statistics
|
·
Not a programming language, although VBA
(Visual Basic for Applications) can create easy-to-use programmed results
|
·
Equations in a cell begin with =
·
Text begins with
·
Copy and paste creates new cells
·
Drag and drop expands an arithmetic sequence
|
DATA TIP 1 Converting online data into useable formats (saves time
and ensures data is free from manual transcription errors)
Highlight and
copy table (Ctrl+C).
Open Notepad and
paste data (Ctrl+V). Save as .txt file (e.g.
ALHR2014data.txt). Ignore any Unicode message (OK).
Open Excel, click
on Data | From Text and import the .txt file (Choose Finish
and OK).
Copy the
required column (e.g., HR) and Paste Special
| Transpose.
Open Notepad and
paste the transposed row (a good trick to get rid of unwanted formatting).
Open Word and
paste the data.
Find and replace:
tab > , (or to whatever desired data format)
3. Internet programming (functions
and scripting) [JavaScript]
JavaScript is an interpreted, client-side language.
Interpreted one line at a time (as opposed to a compiled stand-alone executable).
Client-side resides on your machines web browser and doesnt need to access
a server. JavaScript gives HTML pages (or scrolls) a bit of oomph, allowing dynamic
data manipulation on the fly.
Note that JavaScript is not Java. Java is an object-oriented,
platform-independent language that creates stand-alone applets (as well see in
Section 4), though the program (and name) is derived from a reduced Java instruction
set and the scripting language LiveScript. JavaScript runs programs within a
web browser to update a webpage without refreshing, to verify input data in a form,
to provide functionality through plugin libraries such as jQuery, and especially
to provide unique methods to visualize data. Note, I use Firefox and Windows,
but the same principles apply to other browsers
(Chrome, Explorer, Safari, Opera) and operating
systems.
JavaScript is run within a browser (embedded within
the HTML or hyper-text mark-up language code). Hyper-text because we link to other pages and mark-up because text is formatted using tag pairs, for example, to
bold a word: <b>Hello</b> produces Hello. Its not WYSIWYG (what you see is what you get) as in a word
processor. You have to mark up the text and code with an opening tag and a
closing tag, e.g., bold text <b>bold</b>
text.
So,
lets write our first HTML program.
Use the Notepad++ editor [free
download (8MB)] to create the following file. You can Copy
and Paste and save as HelloWorld.html. Your default browser
icon is automatically associated with the file. Double-click to launch.
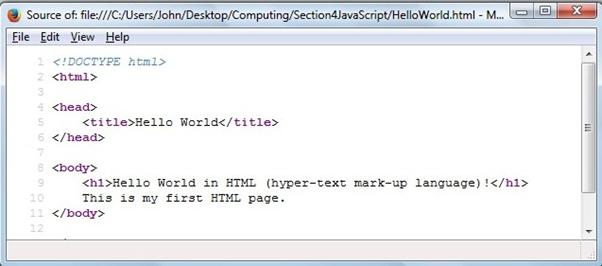
<!DOCTYPE
HTML>
<html>
<head>
<title>Hello World</title>
</head>
<body>
<h1>Hello World in HTML (hyper-text
mark-up language)!</h1>
This is my first HTML page.
</body>
</html>
Note the opening and closing html,
head,
and body
tags.
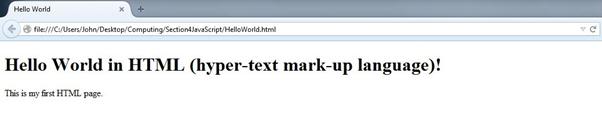
Note: If you right-click on the page and select View
page source, youll see the source code, a useful way to see
whats underneath a web page (thankfully still open source).
Now,
lets write our first program with some imbedded JavaScript.
<!DOCTYPE
HTML>
<html>
<head>
<script>
var message = "Hello World!
This is my first JavaScript page."
</script>
</head>
<body>
<p>Press the button to display a
message.</p>
<button
onclick="myFunction()">Press Me</button>
<script>
function
myFunction() {
document.write(message);
}
</script>
</body>
</html>
Copy and Paste, save as HelloWorldJavaScript.html,
and double-click to launch. Note the opening and closing <script>
</script> tags in the head and body text. All JavaScript code is placed between script tags. Note the var
statement (variable), the onclick function, and
the document.write
statement that displays our message. The program isnt very sophisticated, but
we have all the basics for writing internet programs that will include analytical
and visualization capabilities. And have some fun in the process.
A
few beginning notes:
·
JavaScript statements end with ;
(JavaScript is a C variant language)
·
Comments begin with //
and automatically turn green
·
Functions start with the keyword function
and the code is embedded in braces {
}
·
document.write(
) outputs
text and data to the document. It is not recommended, but is used for now as
simple static output. Later, well use the document object model (DOM) to
change the appearance of a page element (e.g., <h1>, <p>,
<div>).
·
Lots of very useful HTML and JavaScript
resources are available from w3schools.com: HTML(5) Tutorial and JavaScript Tutorial.
A Survey of the JavaScript
Programming Language by Douglas Crockford is also
excellent.
Exercise
3.1
(Powers of 2). Extend the Powersof2
program to 232 (the relevant body text is shown below). What is 232,
264, and 21000? At what power of 2 is the result =
infinity? Why?
<script>
// Calculate and display the powers of two from 2^1 to 2^16.
for (var x = 1,
i = 1; i <= 16;
i += 1) {
x += x;
document.write('2^' + i, ' = ', x, '
' + '<br>');
}
</script>
Exercise
3.2 (Pascals Triangle). In Exercise 2.6, we used a visual 100-step Excel Random Walk. We can
now calculate the exact odds of a random walker being anywhere after any number
of steps (number of reds in a series of roulette spins, heads in a series of
coin flips, upticks in a series of stock periods). Use the PascalsTriangle
program to determine the chance of being at 0 after n = 8, 10, and 20 steps (the relevant body text is shown below). What
are the odds in a best of seven playoff of one team winning 4-0, 4-1, 4-2, and
4-3?
<script>
// Pascal's Triangle.
var N = 16;
var coeffs = [];
// Calculate the
rows.
for (var row = 0;
row <= N; row += 1) {
coeffs.push([]);
for (var column = 0; column <= row; column += 1) {
if (column === 0 || column === row) {
coeffs[row][column] = 1;
} else {
coeffs[row][column] =
coeffs[row-1][column-1]
+
coeffs[row-1][column];
}
}
}
// Display the rows.
for (var row = 1;
row < coeffs.length; row += 1) {
document.write("Row " +
row + ": "
+ coeffs[row].join(' ') +
'<br>');
}
</script>
For some binomial background, check out the article Patterns in Probability: How to See Binomial
Statistics (The International Year of Statistics) and the
video The
Normal Curve (Do
The Math! in 100 seconds).
|
Binomial
(discrete)
|
|
Gaussian
(continuous)
|
|
|
 
|
|
Pascals triangle is perfectly suited for
a limited numbers of rows, but to determine coefficients for higher rows, we
need something more advanced. The Gaussian curve (a continuous version of the
discrete binomial function) was discovered for just this reason by French
mathematician Abraham de Moivre, who wanted to work out higher-order tiers in
Pascals triangle. As you will see in the PascalsTriangle
program, we start to run out of memory a little after N = 1000.
Exercise
3.3 (Pascals triangle becomes a Gaussian). What are the
odds of exactly breaking even after 1,000 trades? (Screen printing uses a lot
of resources, so move the document.write
statement out of the loop and print only the last line.) What are the odds of
exactly breaking even after 2,000 trades? (You will need to use the Gaussian
function to work out the odds of exactly 1,000 H and 1,000 T in 2,000 coin
flips.)
A
short (Dynamic) HTML aside: The Document Object Model (DOM)
HTML is a tree language, where below the document
level (the web page), there are various body elements, such as <h1>,
<p>, <div>, etc., which are containers not just separators, the
appearance of which can be changed in scripting.
For example, I can add a dynamic message to be updated on the fly. The syntax
is a bit muddy, but we declare an element in our script and then write to that
element as indicated below:
Declare
element: document.getElementById("myElement").innerHTML =
Element: <p
id="myElement"></p>
Copy and Paste the HelloWorldMessage
program, save, and double-click to launch. You can now display HTML pages
dynamically, the main reason why JavaScript is used today.
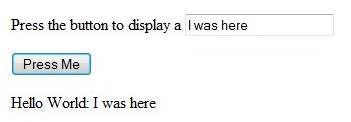
Program
3.0 HelloWorldMessage: A dynamic output
<!DOCTYPE
html>
<html>
<body>
<p>Press the button to display a
<input type="text" id="myText" value="message"></p>
<button onclick="myFunction()">Press
Me</button>
<script>
function
myFunction() {
var
x = document.getElementById("myText").value;
document.getElementById("DynamicContent").innerHTML
= 'Hello World: ' + x;
}
</script>
<p id="DynamicContent"></p>
</body>
</html>
Data
visualization: A time series plotting routine
Now the fun begins. There are many cool plotting programs
to help visualize data in effective ways. All require an HTML/JavaScript code
mix with calls to existing JavaScript (or jQuery) libraries. I will use Google
Charts to start since it is reasonably straightforward to produce
a graph without too much fuss. Once were up and running, you can check out Github
for more exotic ideas, but lets get the data side working first before
thinking about how to add the looks.
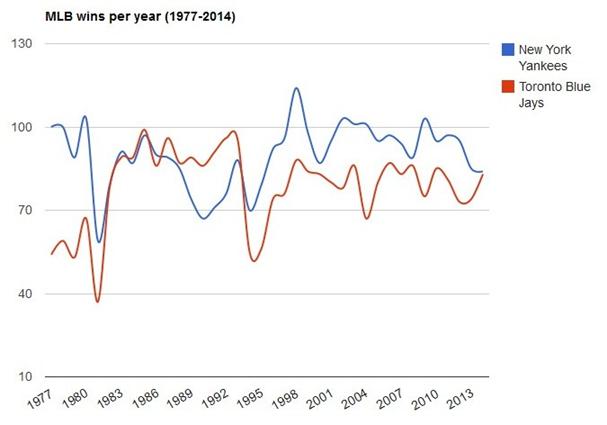
The following plot shows the number of wins for the
New York Yankees and the Toronto Blue Jays from 1977-2014 followed by the PlotLine.html
program
that produced it. Note the <head> </head>
section where all the scripting goes and the <body> </body>
section with its single <div> element (id =
curve_chart) the page container where all the dynamic output
goes.
Program
3.1 PlotLine: Plot using imbedded data
<html>
<head>
<script type="text/javascript"
src="https://www.google.com/jsapi?autoload={
'modules':[{
'name':'visualization',
'version':'1',
'packages':['corechart']
}]
}"></script>
<script type="text/javascript">
google.setOnLoadCallback(drawChart);
function drawChart() {
var data =
google.visualization.arrayToDataTable([
['Year',
'Toronto', 'New York'],
['1977', 54, 100],
//
['2014', 83, 84],
]);
var options = {
title: 'Wins
per year (1977-2014)',
curveType: 'function',
legend: { position: 'right' }
};
var chart = new
google.visualization.LineChart(document.getElementById('curve_chart'));
chart.draw(data, options);
}
</script>
</head>
<body>
<div id="curve_chart"
style="width:
800px; height: 600px"></div>
</body>
</html>
Exercise
3.4 (Plotting time series). Recreate the graph of MLB
wins per year using the PlotLine program. (You will
need to massage and add the New
York
and Toronto
data.)
Exercise
3.5 (Plotting time series). Plot the U.S., Chinese, and Japanese
GDP since 1984, using the PlotLine program. Use
the World
Bank GDP per capita data (current US$) and Trading
Economics population
data.
Exercise
3.6 (Plotting time series). Plot the five quintiles of U.S. household
income from 1967 to 2013 using the PlotLine
program. Use the U.S. Census Bureau data in Table
H-3
(Mean Household Income Received by Each Fifth and Top 5 Percent).
Plotting
an equation using PlotFunction.
There are three ways to introduce data into a
program: 1) Hard-wired into a data statement (as above in the PlotLine
programs), 2) analytically created in code: y
= f(x) for a given function, or 3) read
from a data file (or database). In the next exercise, we will get data
analytically from an equation in a loop and in the following exercise from a
file. With these three methods, you can plot anything.
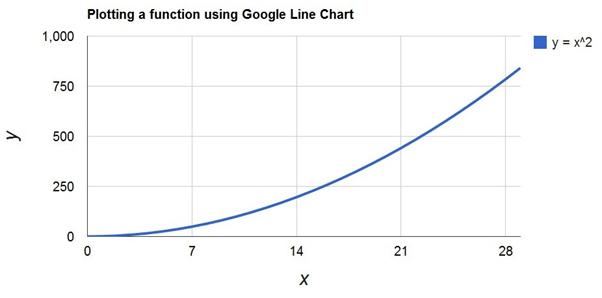
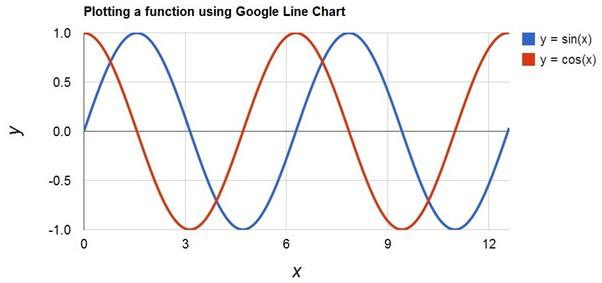
Exercise
3.7 (Plotting a function). We can calculate a data series rather than assigning variables in a long
list. The PlotFunction program below shows how
to initialize 2 arrays (x and y) and how to populate the array with data from a
simple function, y = x2. Change the PlotFunction
program below to plot y = 2x2 8x 3. Change the program to plot a sine and a cosine function for 2
periods. Your results should look like those following. (Note the Math.pow
function and Math.sin and Math.cos
functions.)
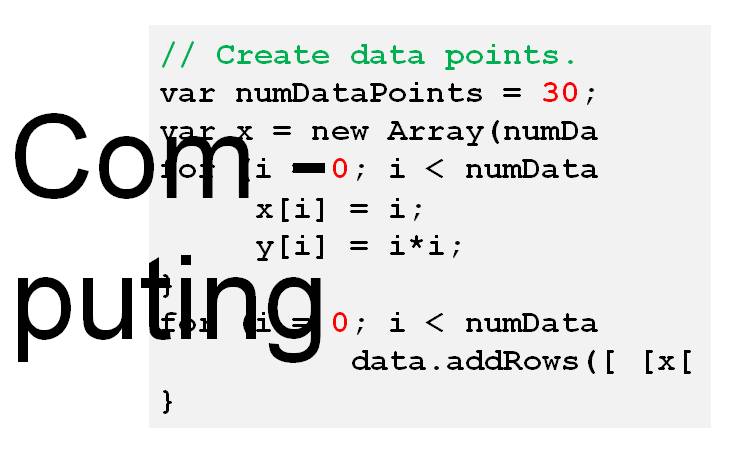
Program
3.2 PlotFunction: Plot using equation data
<html>
<head>
<script
type="text/javascript"
src="https://www.google.com/jsapi"></script>
<script
type="text/javascript">
google.load('visualization',
'1', {packages: ['corechart', 'line']});
google.setOnLoadCallback(drawBackgroundColor);
function
drawBackgroundColor() {
var data = new
google.visualization.DataTable();
data.addColumn('number', 'x');
data.addColumn('number', 'y = x^2');
// Create data
points.
var numDataPoints = 30;
var x = new Array(numDataPoints); var y =
new Array(numDataPoints);
for (i = 0; i < numDataPoints; i++) {
x[i] = i;
y[i] = i*i; // y = x^2 function
}
for (i = 0; i < numDataPoints; i++) {
data.addRows([ [x[i], y[i]] ]);
}
// Set chart options.
var options = {
title:
'Plotting a function using Google Line Chart', titleFontSize: 20,
hAxis:
{ title: 'x', titleFontSize: 30, textStyle: {color: '#000', fontSize: 20} },
vAxis:
{ title: 'y', titleFontSize: 30, textStyle: {color: '#000', fontSize: 20} },
legendFontSize:
20,
lineWidth:
4,
width:
1000,
height:
500
};
// Draw chart.
var chart = new
google.visualization.LineChart(document.getElementById('chart_div'));
chart.draw(data, options);
}
</script>
</head>
<body>
<div
id="chart_div"><div>
</body>
</html>
Exercise
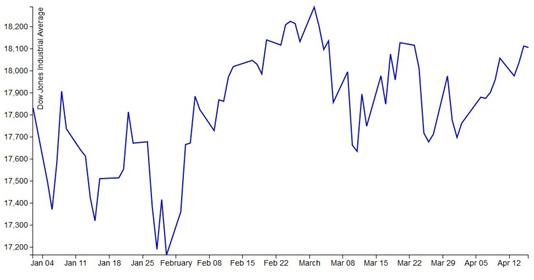
3.8 (Plotting from a file). We can also plot data
from a file, although for security reasons, reading data locally is typically restricted
in the browser sandbox. We can work around this for now, but for security and
better functionality data files are best downloaded from a server-side
database. Here, we plot data from a file (Dow
Jones daily closing value from this year) using the PlotDataFile
code (mostly D3 style attributes). Plot the S&P 500 or NASDAQ closing
values for the year using the PlotDataFile
program and appropriate data file.
So
whats the big deal?
Okay, so you might think we have only reinvented an
already working wheel, plotting data that is easily plotted in Excel. But the main
difference is that we can now do sophisticated analysis on the data before plotting.
Or make the data sing using dynamic JavaScript functionality with exotic
animations. There are numerous existing programs from the Google
Chart Gallery and D3 Gallery.
Lets start with the canned Google Chart glitz of a Geo Chart that plots demographic
data on a map.
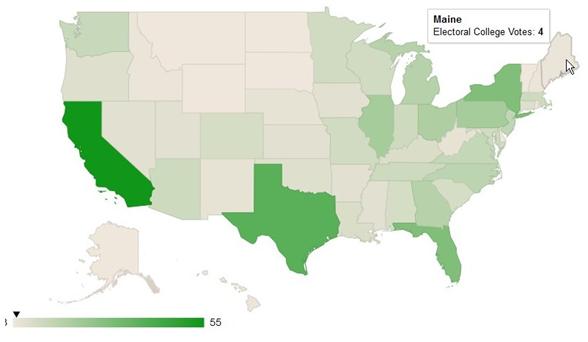
Exercise
3.9 (Geo data). Here is the code and output of a Geo
Chart for the U.S. Electoral College. Make a Geo Chart for the world and/or Europe
for population, GDP, debt,
. (Bonus: select the tool tip attribute from an
Option box input.)
<html>
<head>
<script type="text/javascript"
src="https://www.google.com/jsapi"></script>
<script type="text/javascript">
google.load("visualization",
"1", {packages:["geochart"]});
google.setOnLoadCallback(drawRegionsMap);
function drawRegionsMap() {
var data =
google.visualization.arrayToDataTable([
['State', 'Electoral College Votes'],
['Alabama', 9],
['Alaska', 3],
//
['Wisconsin', 10],
['Wyoming', 3]
]);
var options =
{'region':'US','resolution':'provinces'};
var chart = new
google.visualization.GeoChart(document.getElementById('chart_div'));
chart.draw(data, options);
};
</script>
</head>
<body>
<div id="chart_div"
style="width:
1000px; height: 500px;"></div>
</body>
</html>
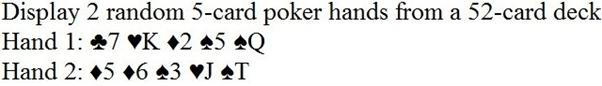
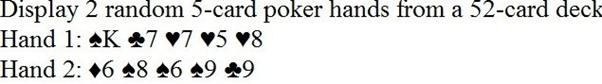
Exercise
3.10 (Five-card poker hands).
The following two poker hands were generated by the FiveCardPoker
program. Use conditional statements (If ... Else)
to evaluate which is the winning hand.
<!DOCTYPE
html>
<body>
Display 2 random 5-card poker hands from a
52-card deck<br>
<script>
// The deck.
// var suit = [
"C", "D", "H", "S" ];
var suit = [
"♣", "♦", "♥",
"♠" ];
var rank = [ "2",
"3", "4", "5", "6", "7",
"8", "9", "T", "J", "Q",
"K", "A" ];
var deck = [];
var N = 52;
var H = 5;
// Initialize
the cards in the deck.
for (var i = 0; i < rank.length; i++)
{ for
(var j = 0; j < suit.length; j++)
{ deck[suit.length*i + j] = suit[j] + rank[i];
}
}
// Shuffle the
deck.
var pick; var temp;
for (var i = 0; i < N; i++)
{
pick =
Math.floor(Math.random()*N);
temp = deck[pick];
deck[pick] = deck[i];
deck[i] = temp;
}
// Print out
the 2 hands.
document.write('Hand 1: '); for (var
i = 0; i < H; i++) {document.write(deck[i] + " "); };
document.write('<br>')
document.write('Hand 2: '); for (var
i = H; i < 2*H; i++) {document.write(deck[i] + " "); }
</script>
</body>
</html>
|
Pros
|
Cons
|
Special syntax
|
|
·
Exciting dynamic HTML is the future
·
DOM dynamically changes appearance and
behaviour of previously static elements (containers not just seperators)
·
Lots of free canned programs and libraries
|
·
Some muddled syntax
·
Mixes style formatting of CSS and HTML tags
·
Doesnt do arrays well for numerical analysis
·
Not the best debugging platform
|
·
var x = [] is an array
·
Function variables have function scope; without
var global scope
·
Dot syntax, e.g., object.property
·
Tag pairs open and close
|
Some Suggested Reading
Cogswell, J. (2014). 5 Programming Languages Youll
Need Next Year (and Beyond). Dice. Retrieved from http://news.dice.com/2014/07/29/5-programming-languages-youll-need-next-year-beyond/?icid=ON_DN_UP_JS_AV_OG_RA_2
Guo,
P. (2014). Python is Now the Most Popular Introductory Teaching Language at
Top U.S. Universities. BLOG@CACM. Retrieved from http://cacm.acm.org/blogs/blog-cacm/176450-python-is-now-the-most-popular-introductory-teaching-language-at-top-us-universities/fulltext
Thackray,
A., Brock, D. C., and Jones R. (2015). Fateful Phone Call Spawned Moores Law
[Excerpt] Scientific American, April
17, 2015. Retrieved from http://www.scientificamerican.com/article/fateful-phone-call-spawned-moore-s-law-excerpt/?page=1
Web
Design (2014). 20 superb data visualisation tools for web designers. Creative
Bloq. Retrieved from http://www.creativebloq.com/design-tools/data-visualization-712402
Wissel,
L. (1999). How does a logic gate in a microchip work? Scientific American, October 21, 1999. Retrieved from http://www.scientificamerican.com/article/how-does-a-logic-gate-in/
PROJECTS
Project
1 (Gaussian select). Calculate a z-score with animated graph.
Projecr
2 (Monopoly Monte Carlo). Calculate the odds of landing on
any Monopoly square and plot the result.
Project
3 (Blackjack/Poker odds). Calculate the Blackjack odds for
hitting/standing against any dealer up card OR calculate the Hold Em poker
odds for any head-to-head 2-card matchup.
Sample Programs

|
• How do pyramid scams work? • Are reality television shows fair? •
• Why are sports so uncompetitive? • Who really broke the bank in 2009? •
Description
Do the Math! is a refreshing look at mathematical concepts and moral dilemmas in the increasingly more numerate world of everyday living.
Aiming to popularize and inform, Do the Math! does for numbers what Eats, Shoots, and Leaves does for words.
Quotes and comments
"One can pop it open anywhere with equal reward."
"The style is VERY easy to read and unusually entertaining."
"The core concept of the inherent morality of mathematics is excellent."
Sage
Amazon
Intro
Reviews
|